Project
How might we
Understand how Yarra Valley Water can best use data from Digital Metering to influence behaviour
change around water consumption and improve service delivery.
My role
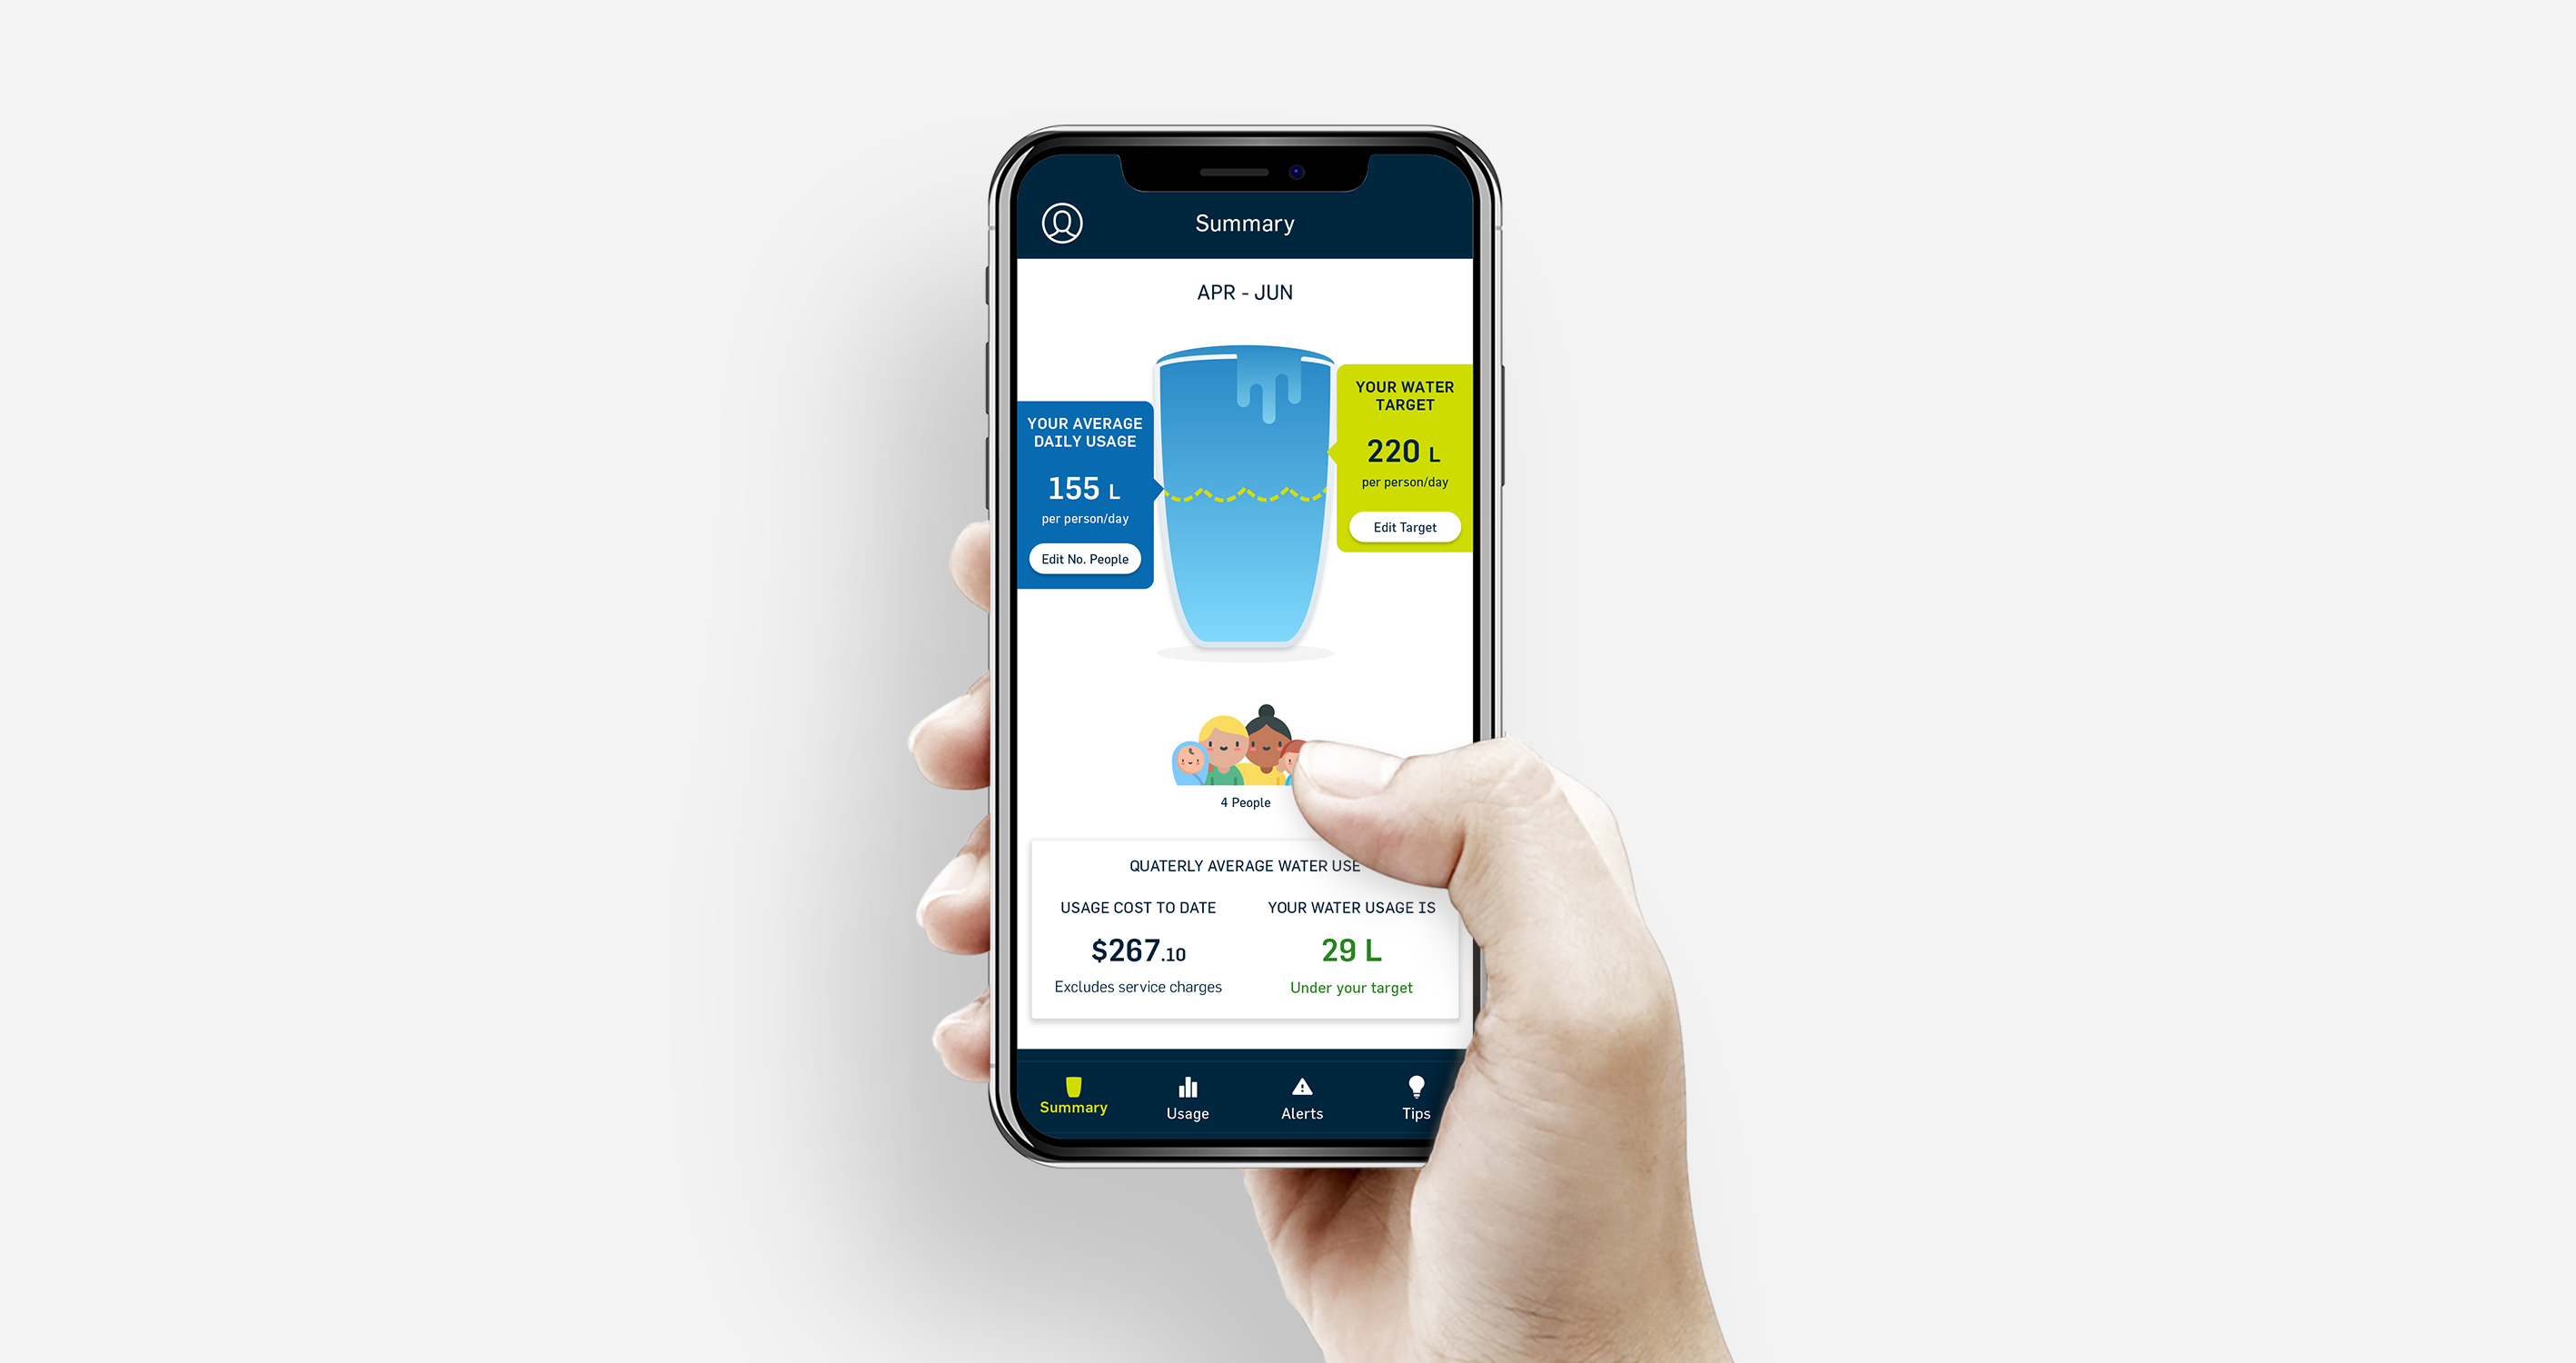
A lot of research and contextual interviews took place before I started on this project.
Great insights were captured and it was my role as a UX designer to work with the agency
engaged to develop the app to make sure our insights were taken into consideration.
Compromise was sometimes required when balancing business objectives and design. There were
limitations with budget, scope and backend capability (how YVW access their data and what data
they could currently surface for the app)
I also provided feedback, guidance and governance on the UX/UI components of the app and participated in user
testing sessions for the prototypes.
CX approach
How has the team worked together to champion CX, and what effect has this had on the wider business?
CX championed an iterative, customer-centric approach to trial the rollout of digital water meters.
Working closely with the Digital Meter Project Team, CX worked together to facilitate research to better understand customers’
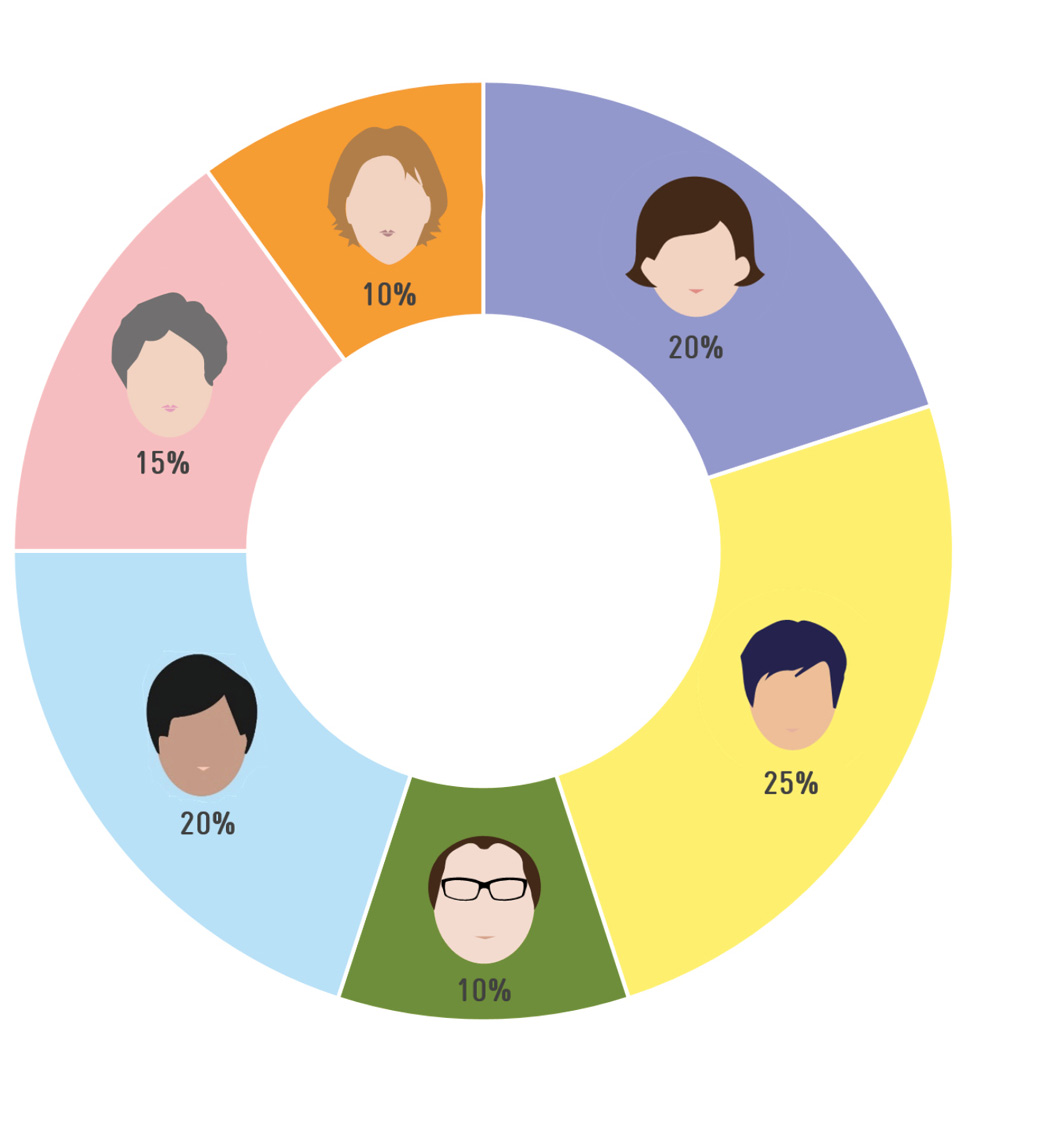
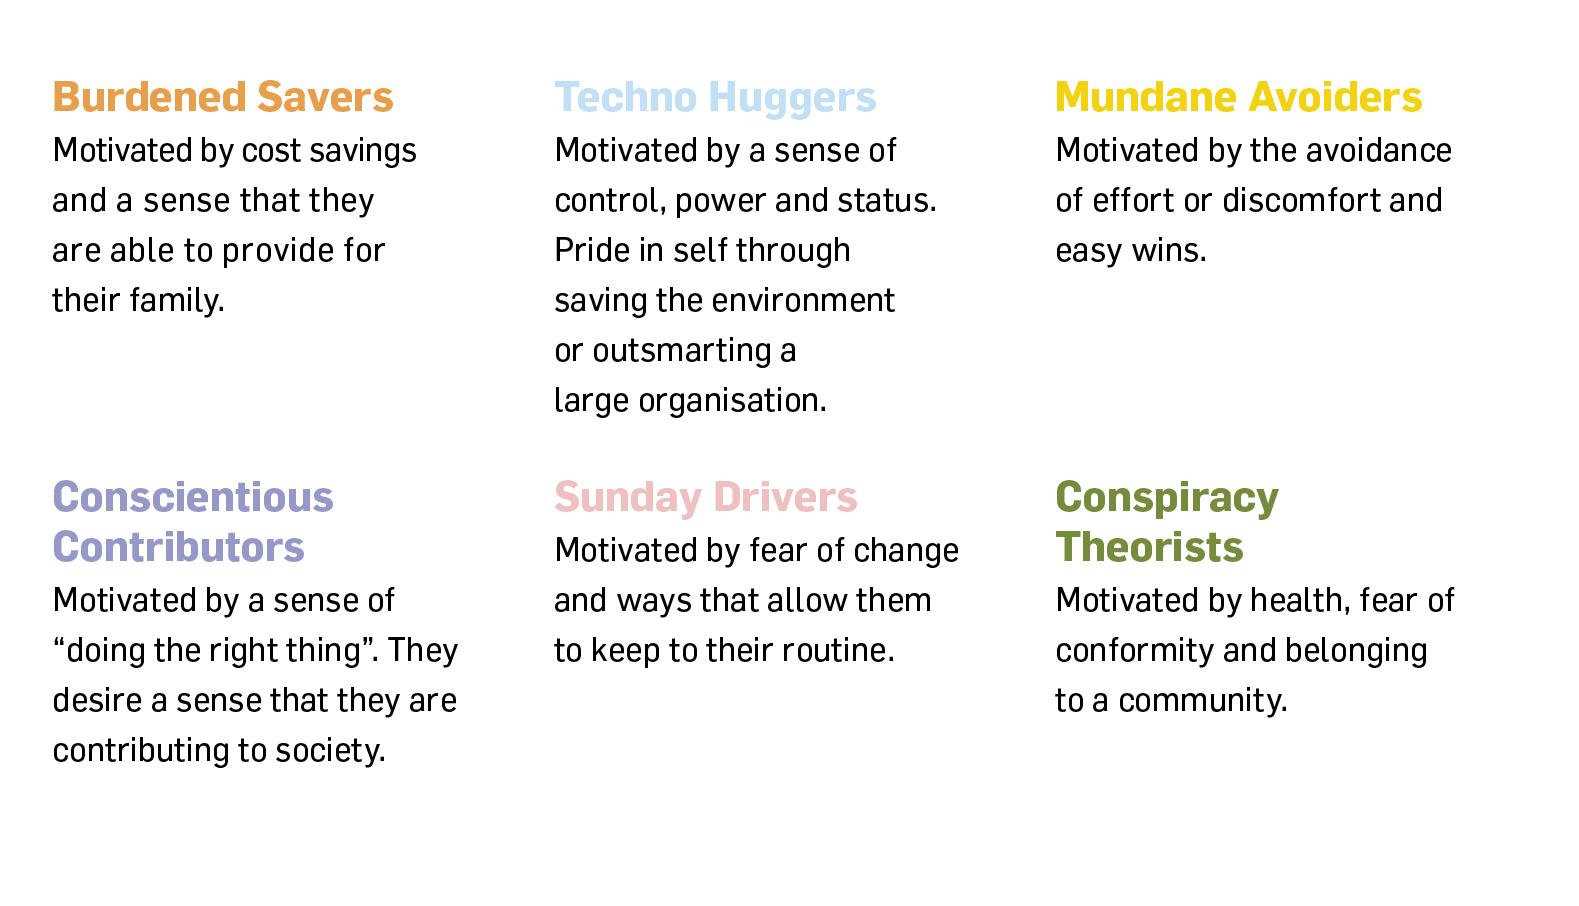
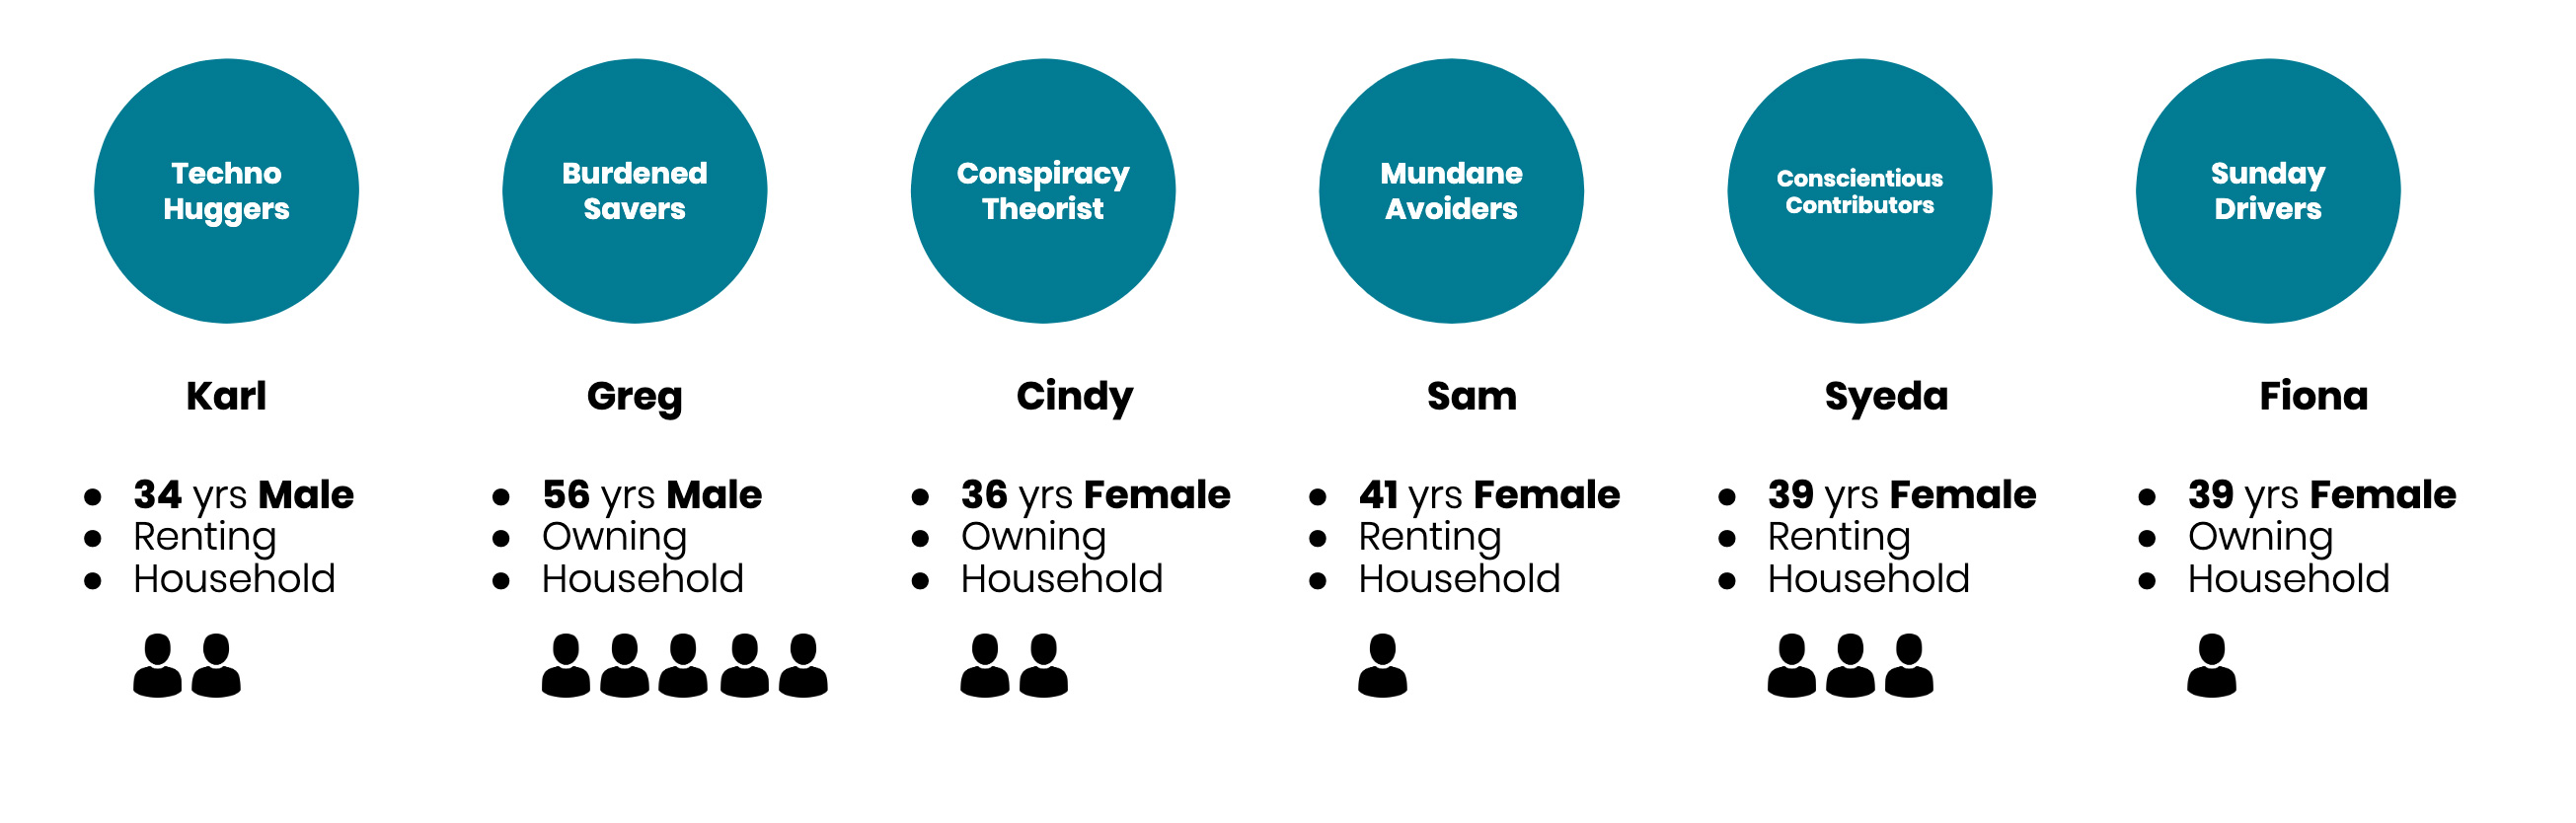
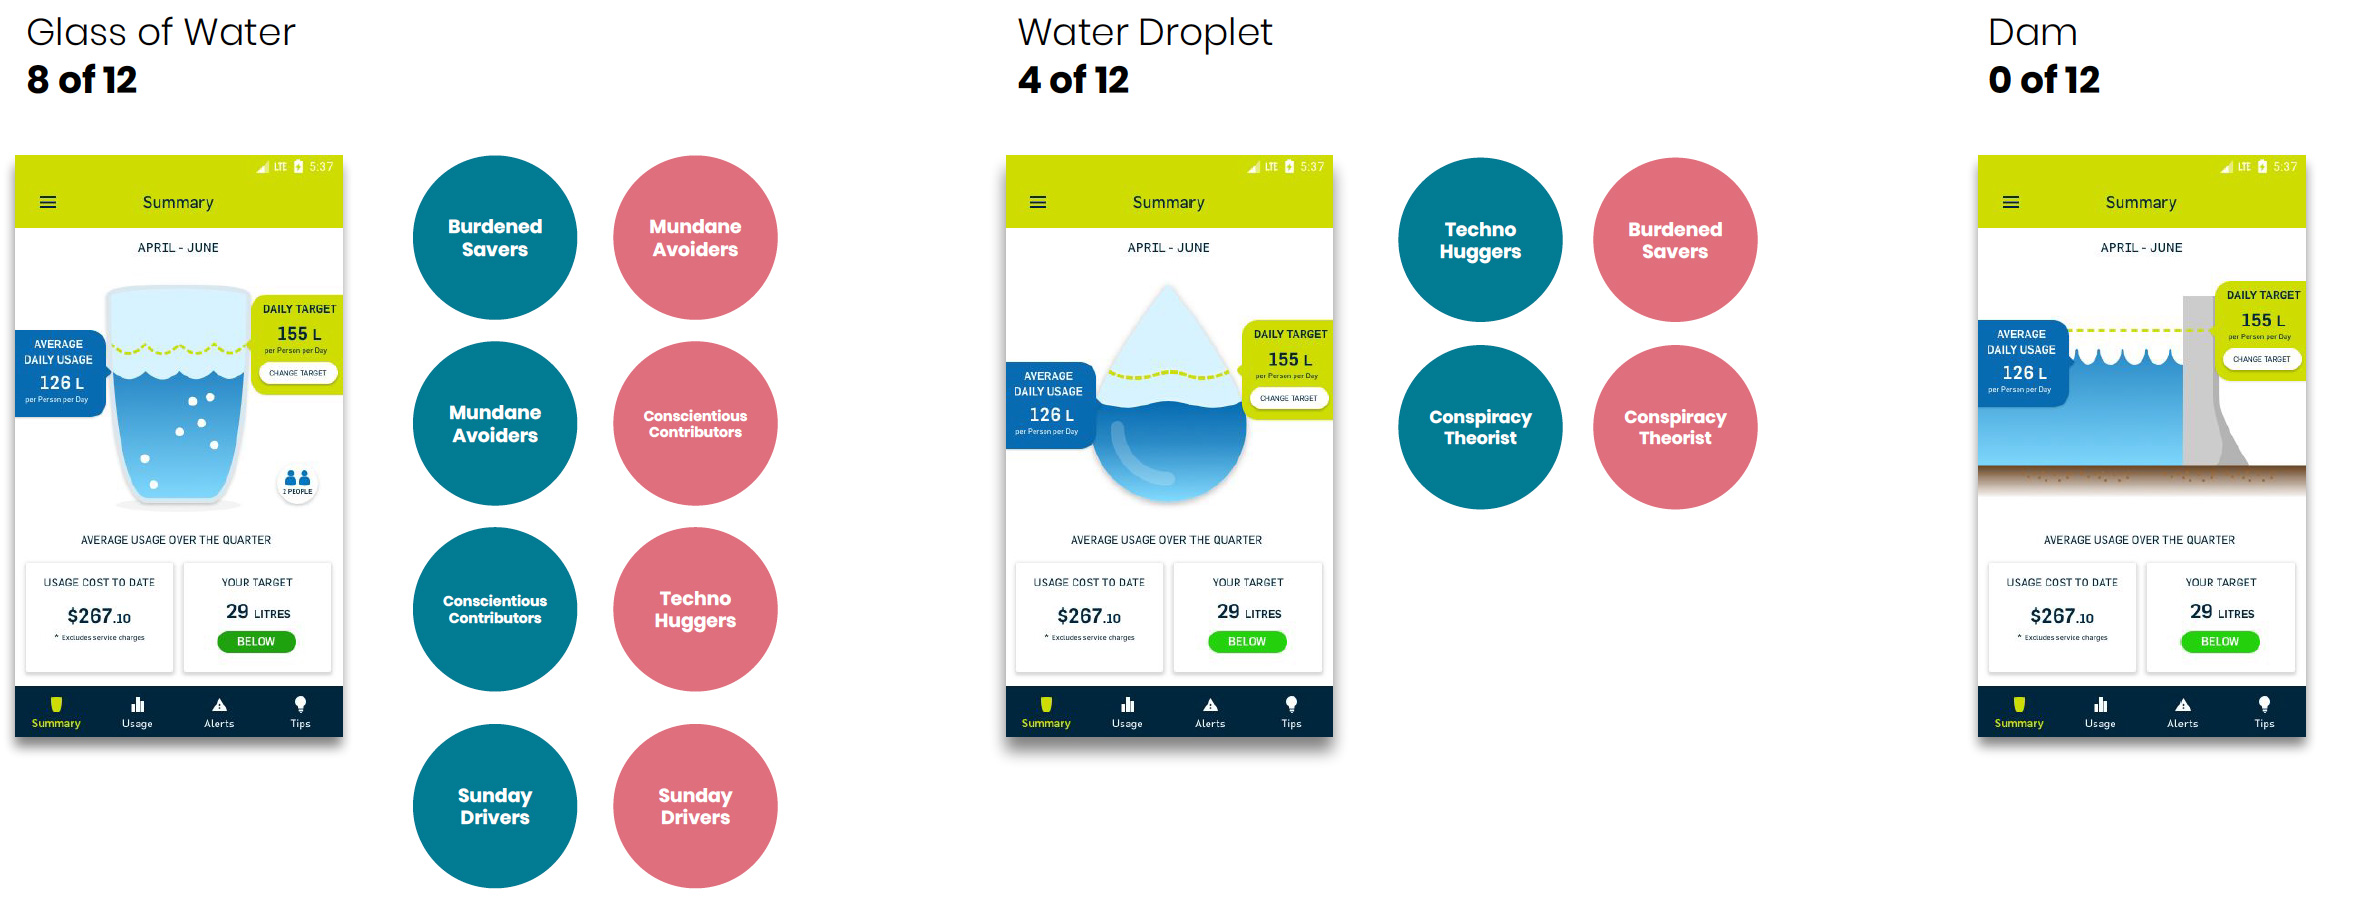
desired experiences in relation to the installation of a digital water meter. The outcomes of the research lead to the creation
of a set of customer personas, the development of end-to-end future state journeys and the prototype of a digital meter app.
During this project, CX team members focussed on their area of speciality, while working seamlessly as a wider cross-functional team.
This project is still in its infancy, but the research, artefacts (service blueprints, customer personas, journey maps etc) and processes that
were developed as part of this work are already having a positive impact. Post implementation research has produced very positive CSAT results,
a digital meter app is now available, and the learnings from this project are now being used to redesign other related experiences.
The success of this project has also helped to further embed CXs value across the business.

Service design
Aware and install, happy day scenario (service blueprint example).